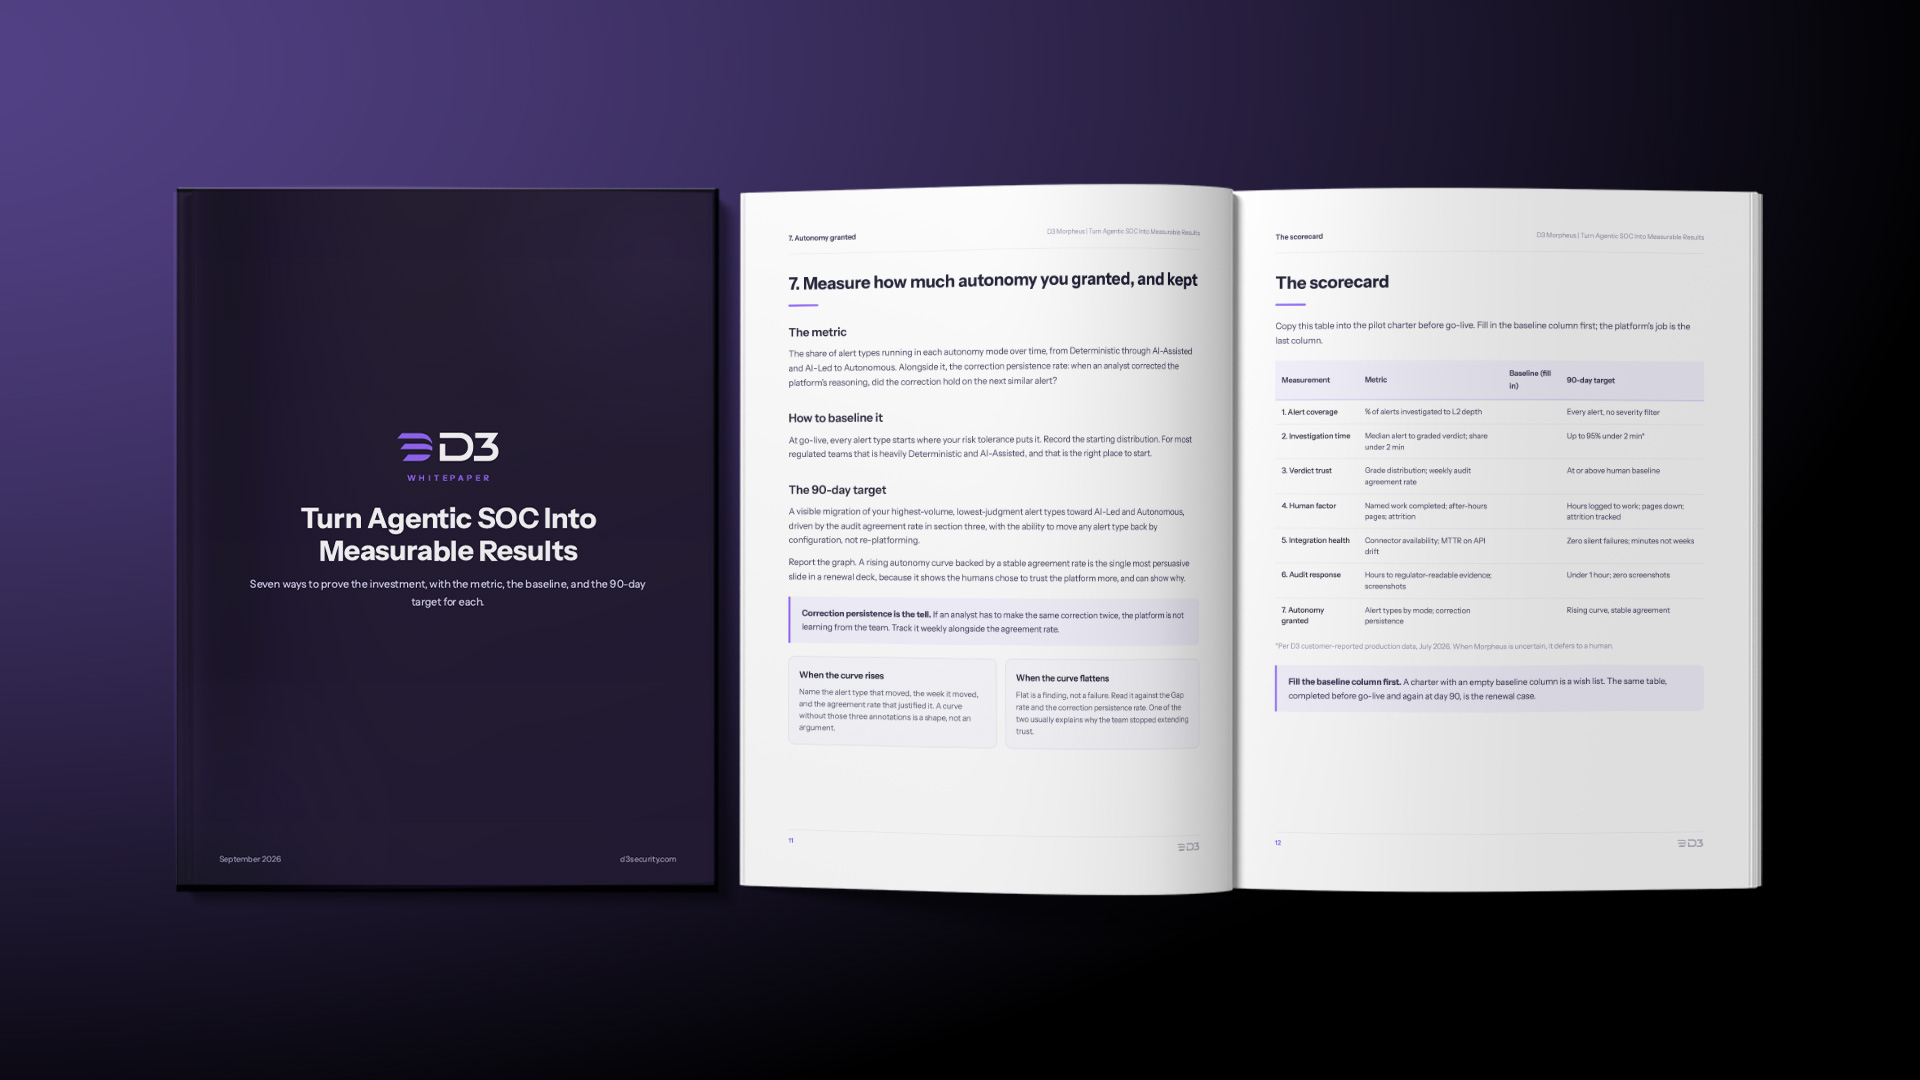
Most agentic SOC deployments stall at the pilot stage for one reason: nobody agreed what “working” would look like before the platform went live. This brief gives SOC leaders seven measurements that turn an AI pilot into a business case, each one taken from production deployments and each one a number your CISO, your auditor, and your CFO will recognize.
Why agentic SOC pilots stall
Agentic SOC platforms investigate, decide, and act on alerts with a degree of independence, under governance a human sets. Every SOC leader who has run one knows the pattern that follows. The demo is impressive. The pilot handles real alerts. Then the renewal conversation arrives and the room asks the question nobody prepared for: what did it actually change?
The problem is rarely the technology. It is that the pilot was scoped as an experiment, not a measurement. Without a baseline taken before the platform went live, without an agreed definition of a good verdict, and without a plan for how much autonomy the team would grant and when, the result is a set of anecdotes. Anecdotes do not survive a budget review.
The seven measurements below fix that. They are ordered the way a deployment unfolds: coverage and speed first, because they show up in the first week; trust and the human factor next, because they take a month to stabilize; integration health, audit readiness, and autonomy progression last, because they are the numbers that prove the platform is compounding, not plateauing. Each one names the metric, how to take the baseline, and a realistic 90-day target.
The principle. The more of an AI’s work you can check, the more work you can hand it. Every metric in this brief is a way of checking.
Take every baseline before go-live. A baseline reconstructed after the platform is running is an estimate, and an estimate is what a budget review takes apart first.
Measure alert coverage, not alert volume
Every SOC reports how many alerts it receives. Almost none report how many it investigates. Industry estimates put the share of alerts that are never investigated at all between 40 and 67 percent, and the gap is where dwell time lives. An agentic SOC changes that number first, before it changes anything else.
The metric
Percentage of alerts that receive an L2-depth investigation: cross-tool correlation, attack-path tracing, and a graded verdict with evidence. Not “touched.” Not “enriched.” Investigated to the depth a senior analyst would reach if they had the time.
How to baseline it
Pull 30 days of closed alerts. Count how many have an investigation record beyond the detection itself. Most teams find the honest number is the criticals plus whatever the night shift got to. That is the baseline, and it is usually uncomfortable.
The 90-day target
100 percent of alerts investigated to L2 depth. This is the one metric where the target is binary. If the platform is triaging some alerts and skipping others by severity, you have bought a faster L1 bot, not an agentic SOC.
Morpheus AI runs the same investigation on every alert regardless of initial severity, because low-severity alerts are where lateral movement hides.
Time the investigation, not the response
Mean time to respond is the number every dashboard shows and the one least under the SOC’s control, because it includes the time waiting for a human to open the case. The number an agentic SOC actually moves is the time from alert to a verdict a human can act on.
The metric
Median time from alert ingestion to a graded verdict with evidence attached. Report it as a distribution, not a single number: what share of alerts reached a verdict inside two minutes, inside ten, and what happened to the tail.
How to baseline it
Time your analysts. For a representative sample of alert types, measure the elapsed time from alert to the moment an analyst wrote a disposition, including the queue wait. Published benchmarks put manual triage around 56 minutes per alert; your number may be better or worse, and either way it is the number the platform has to beat.
The 90-day target
Up to 95% of alerts triaged at L2+ depth in under two minutes, per D3 customer-reported production data, July 2026.
The tail matters as much as the headline. The alerts that do not resolve in two minutes should reach an analyst with the investigation attached, not as a cold start. Measure the tail’s handoff quality separately, because it is where the trust argument in section three is won or lost.
Grade the verdicts, then audit the grades
Speed without trust is a liability. A platform that closes 95 percent of alerts in two minutes is only valuable if the closures are right, and “right” has to be something you can check without re-doing the investigation. This is the measurement most pilots skip, and it is the one that decides whether the team will ever hand the platform more work.
The metric
Two numbers. First, the verdict grade distribution: what share of findings the platform marked Confirmed (source evidence attached), Inferred (reasoning shown, evidence circumstantial), and Gap (looked, found nothing, said so). Second, the audit agreement rate: when an analyst spot-checks a sample of graded verdicts, how often do they agree with the grade?
How to baseline it
Before go-live, have two senior analysts independently disposition the same 50 alerts and record their agreement rate with each other. That is your human baseline, and it is rarely above 85 percent. The platform should be held to that standard, not to perfection.
The 90-day target
Audit agreement at or above your human baseline on a weekly sample of at least 30 verdicts, with the sample weighted toward Inferred findings, where disagreement is most likely. Track the Gap rate as a health signal: a platform that never reports a Gap is one that is guessing.
Morpheus AI grades every finding and defers to a human when it cannot confirm, so the Gap rate is visible by design, not hidden inside a confidence score. A platform that reports a single confidence percentage, and no evidence grade, cannot be audited this way. You can agree or disagree with a grade. You cannot agree or disagree with 87 percent.
Measure what your team did with the time back
Headcount is the number the CFO understands, and the temptation is to promise a reduction. Resist it. The measurable result of an agentic SOC is what your people were able to do once the queue stopped owning their day, and how it felt to work there. Both can be counted, and together they are the most persuasive numbers in this brief because they are the ones your team will help you gather.
The metric, in three parts
Work that got done
Threat hunts run per quarter. Detection rules written or tuned. Hardening tickets closed. Tabletop exercises held. Purple-team sessions completed. These are the things every SOC says it would do if it had time, and the count of them is the proof that the time arrived.
Stress the team carried
After-hours pages per analyst per month. Escalations between midnight and six. Overtime hours. The share of shifts that ended with an unreviewed queue. These numbers already sit in your paging, scheduling, and ticketing tools; nobody pulls them because nobody expected them to move.
People who stayed
Analyst attrition over twelve months and time to fill an open seat. Experienced SOC analysts are among the hardest hires in security, and a team that stops losing them has a result the finance team can price without help.
How to baseline it
Two weeks of time tracking by alert category before go-live, plus a pull of the last six months of paging and overtime data and the last year of hiring records. Most teams find that 60 to 70 percent of analyst time was triage, that the night shift carried most of the after-hours load, and that the hunting program existed mostly as an intention.
The 90-day target
A published log of reclaimed hours converted into named work, a measurable drop in after-hours pages and shifts ending with unreviewed alerts, and attrition tracked as a leading indicator.
Retention will not move inside 90 days. The stress numbers will, and they predict it. A SOC that can say “we ran our first threat hunt in eighteen months and nobody was paged after midnight in March” has a result. A SOC that says “analysts are less busy” has an anecdote.
For service providers, the same three measures, expressed per tenant: alerts handled per analyst, after-hours load per analyst, and bench retention. Analyst leverage is the margin, and these are its leading indicators.
Track integration uptime as a security metric
Every automation platform depends on connectors to the SIEM, EDR, identity provider, and ticketing system, and every one of those vendors changes its API on its own schedule. When a connector breaks silently, automation stops and alerts queue, and the average time to notice is measured in days. Legacy security orchestration, automation and response (SOAR) deployments routinely lost 30 to 40 percent of admin time to this maintenance, which is one reason so many of them were abandoned.
The metric
Connector availability as a percentage, and mean time to repair when a vendor API change breaks a connector. Both should be reported the way you report any other production system, because that is what an agentic SOC is.
How to baseline it
Pull the ticket history for integration fixes over the last year. Count the incidents, the hours per fix, and the longest gap between a break and its detection. If your current platform does not surface connector health, the absence of the data is itself the baseline.
The 90-day target
Zero silent failures and a repair time measured in minutes, not weeks. Morpheus AI integrations self-heal: the platform detects API drift, generates the corrective code, and validates it, at 18 minutes MTTR vs 4 to 6 weeks. Whichever platform you run, the measurable result is the same: integration maintenance stops appearing in your engineers’ calendars.
Time your audit response
Regulators and internal auditors have started asking a new question of security operations: when the AI made a decision, show me why. NIS2, DORA, the EU AI Act, SEC incident disclosure rules, and NYDFS Part 500 all expect an evidence trail that a non-engineer can read. For most SOCs, producing that trail today means screenshots, exported logs, and a week of someone’s time.
The metric
Hours to produce a complete, regulator-readable record for a given incident: what was detected, what was investigated, what evidence supported each finding, what action was taken, who approved it, and in what autonomy mode. A second, simpler number: how many screenshots the last audit required.
How to baseline it
Take the last incident your compliance team asked about and reconstruct how long it took to assemble the evidence package, across how many systems. Include the time spent explaining what the automation did, because that explanation is exactly what the trail should replace.
The 90-day target
Evidence package for any incident in under an hour, exported from one record, with zero screenshots. Morpheus AI produces one audit trail per incident in the same format regardless of whether a deterministic playbook, an AI-assisted step, or an autonomous action did the work, which is what lets a compliance reviewer read it end to end without a SOC engineer at their elbow.
Measure how much autonomy you granted, and kept
The last measurement is the one that proves the platform is compounding. A pilot that runs at the same autonomy level in month three as in week one has stopped earning trust. The measurable result of an agentic SOC is the autonomy your team chose to extend, alert type by alert type, because the first six metrics gave them reason to.
The metric
The share of alert types running in each autonomy mode over time, from Deterministic (no AI in the chain) through AI-Assisted (analyst approves every step) and AI-Led (analyst signs off, response runs) to Autonomous (gates set at design time). Alongside it, the correction persistence rate: when an analyst corrected the platform’s reasoning, did the correction hold on the next similar alert?
How to baseline it
At go-live, every alert type starts where your risk tolerance puts it. Record the starting distribution. For most regulated teams that is heavily Deterministic and AI-Assisted, and that is the right place to start.
The 90-day target
A visible migration of your highest-volume, lowest-judgment alert types toward AI-Led and Autonomous, driven by the audit agreement rate in section three, with the ability to move any alert type back by configuration, not re-platforming.
Report the graph. A rising autonomy curve backed by a stable agreement rate is the single most persuasive slide in a renewal deck, because it shows the humans chose to trust the platform more, and can show why.
The scorecard
Copy this table into the pilot charter before go-live. Fill in the baseline column first; the platform’s job is the last column.
| Measurement | Metric | Baseline (fill in) | 90-day target |
|---|---|---|---|
| 1. Alert coverage | % of alerts investigated to L2 depth | 100% | |
| 2. Investigation time | Median alert to graded verdict; share under 2 min | Up to 95% under 2 min* | |
| 3. Verdict trust | Grade distribution; weekly audit agreement rate | At or above human baseline | |
| 4. Human factor | Named work completed; after-hours pages; attrition | Hours logged to work; pages down; attrition tracked | |
| 5. Integration health | Connector availability; MTTR on API drift | Zero silent failures; minutes not weeks | |
| 6. Audit response | Hours to regulator-readable evidence; screenshots | Under 1 hour; zero screenshots | |
| 7. Autonomy granted | Alert types by mode; correction persistence | Rising curve, stable agreement |
*Per D3 customer-reported production data, July 2026.
Frequently Asked Questions
How long should an agentic SOC pilot run?
Ninety days is enough for all seven measurements to stabilize. Coverage and speed are visible in week one. Verdict trust needs at least six weekly audit samples. Autonomy progression needs the trust data first, so it is the last to show movement.
What is the difference between a confidence score and an evidence grade?
A confidence score is the platform’s opinion of itself, expressed as a percentage. An evidence grade (Confirmed, Inferred, Gap) tells you what kind of evidence sits behind a finding, which is something an analyst can check and agree or disagree with. Only the second one can be audited.
Should the pilot include response actions or only investigation?
Include response, in Deterministic or AI-Assisted mode. Investigation-only pilots produce verdicts but no measurable change in analyst hours, integration health, or audit readiness, because those results come from the response layer. Start with the gates closed and open them as the agreement rate earns it.
How does this apply to a managed security service provider?
Every measurement applies, with two translations: the human-factor measures become alerts or tenants per analyst and bench retention, and autonomy is tracked per client, not per alert type, because clients have different risk appetites. The audit-response metric becomes a selling point, not a cost, since it is evidence you can hand a client’s regulator.
What if we are migrating from a legacy SOAR at the same time?
Take the baselines on the SOAR before cutover; they are usually the strongest part of the business case. Integration maintenance hours and audit response time in particular tend to be far worse under legacy SOAR than teams realize until they measure them.
Evidence and Assumptions
See the seven measurements on a live investigation
D3 Morpheus is an agentic SOC platform that runs L1 and L2 investigation end to end on every alert, grades every verdict by its evidence, and produces one audit trail per incident across four autonomy modes.
Book the 30-minute demo