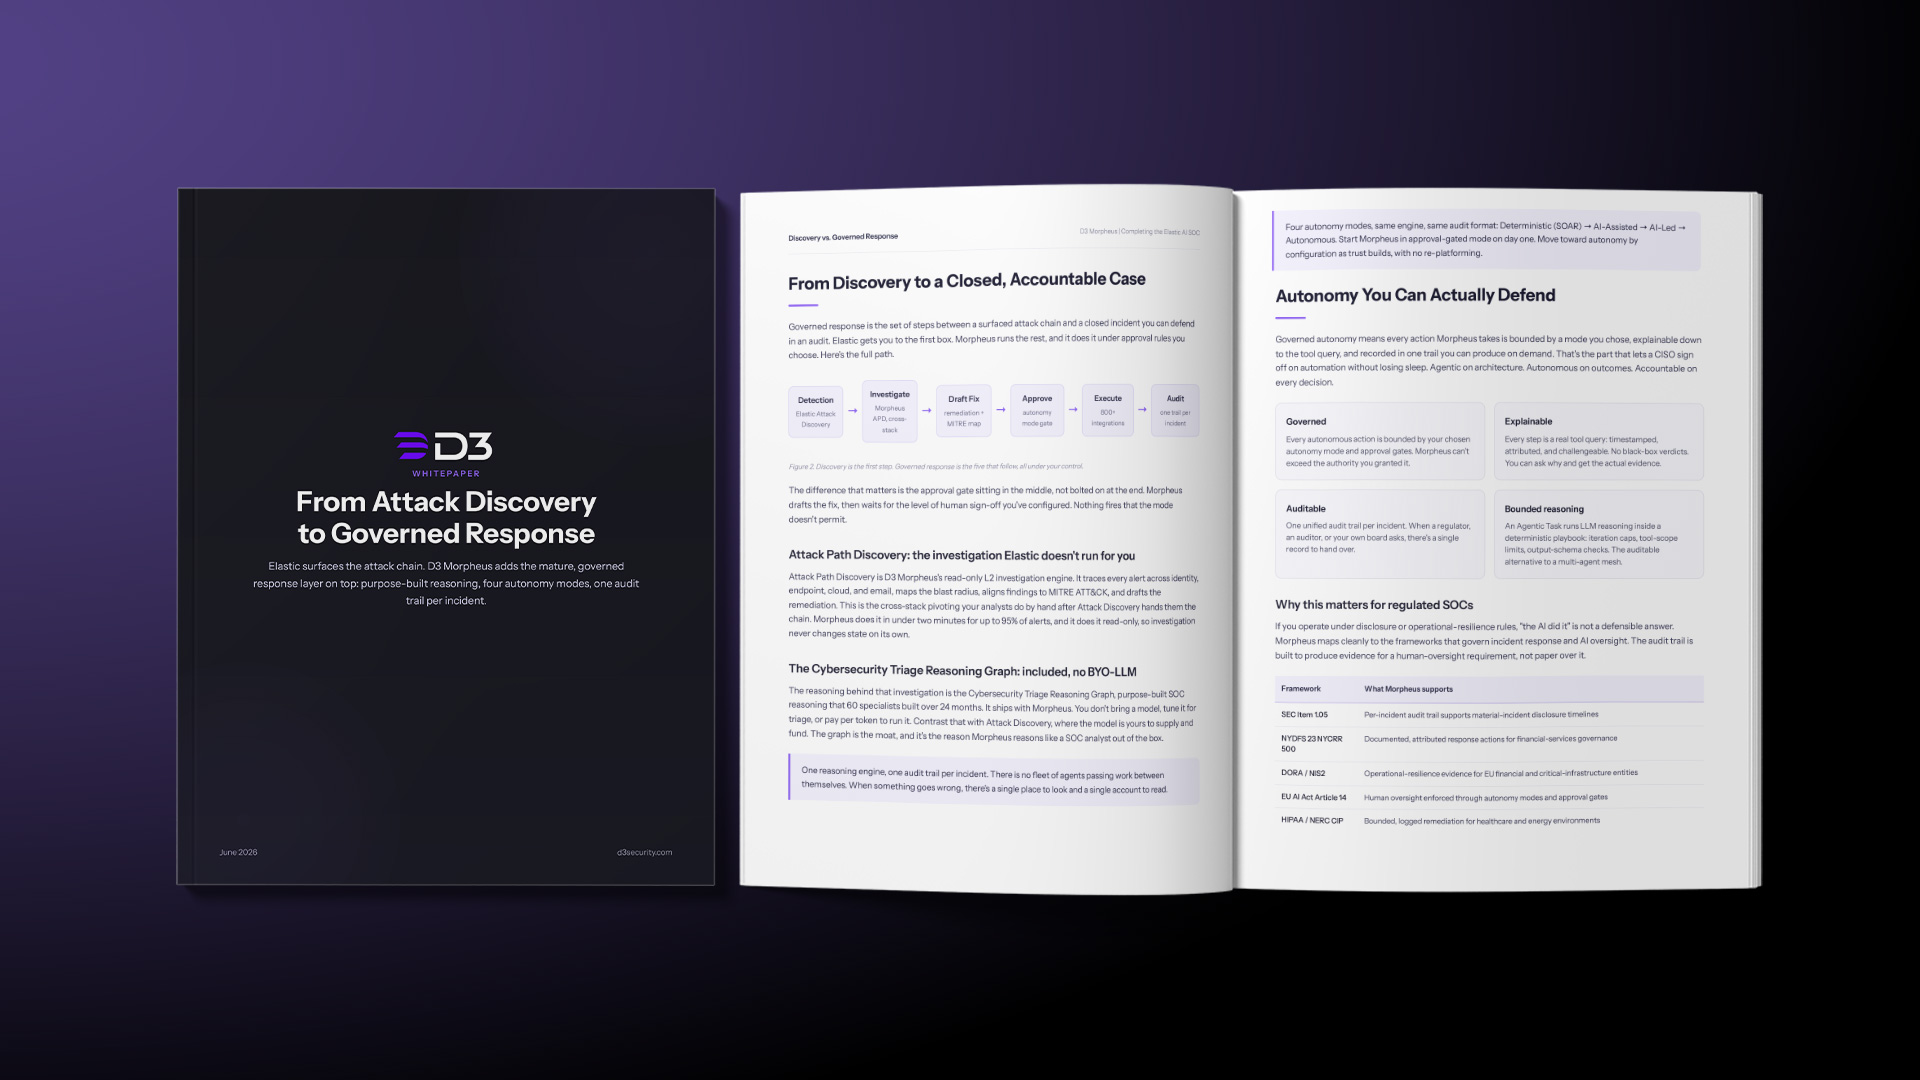
Executive Summary
Elastic Security is a strong data platform and detection engine, and Elastic’s Attack Discovery is genuinely good at one hard job: reading scattered alerts and surfacing the attack chain behind them. But discovery is the start of an incident, not the end. Someone still has to investigate across the stack, decide what to do, get approval, and execute the fix. That work is where most SOCs lose hours, and it’s the work Elastic largely leaves to you.
D3 Morpheus, the autonomous SOC platform from D3 Security, sits on top of Elastic as the governed response layer. It keeps Elastic as the system of record and the place detections live. Then it does the part that follows discovery: deep cross-stack investigation, a drafted remediation, an approval gate you control, and the fix itself across 800+ integrations. Up to 95% of alerts get triaged and L2-investigated in under two minutes. Every action lands in one audit trail per incident.
This paper makes a narrow, factual case. Elastic finds the attack. Morpheus governs the response. The two fit together, and the result is an AI SOC that closes the loop without handing automation a blank check.
Elastic answers “what happened?” Morpheus answers “what do we do about it, who approved it, and can we prove it later?” SOC teams need both. Most platforms give you one.
Who this is for
SOC leaders and detection engineers already running Elastic Security who like the platform, want to keep it, and need a response layer they can govern. If you’ve turned on Attack Discovery and asked “now what runs the fix, and how do I keep it accountable?” this paper is the answer. Nothing here asks you to rip out Elastic or move your data. The argument is additive: keep what works at the bottom, add what’s missing on top.
Table of Contents
Elastic Is Strong at Discovery. Discovery Isn’t the Whole Incident.
Elastic Attack Discovery is a generative-AI feature in Elastic Security that groups related alerts into attack chains and writes a readable summary of what likely happened. It’s good work. It cuts through alert noise and gives an analyst a starting narrative built from a wall of disconnected signals. We’re not here to argue with that. Elastic stays the data platform and the detection engine.
Two things about Attack Discovery shape what comes next, and both come straight from Elastic’s own documentation.
1. Attack Discovery runs on a model you bring and pay for
Attack Discovery needs a connected large language model to function. Per Elastic’s documentation, you supply that LLM connector yourself, whether a third-party API or a self-hosted model. So model selection, tuning, token spend, and inference cost are all yours to own and budget. That’s a reasonable design choice for an open platform. It also means the quality and the cost of the reasoning depend on a model Elastic doesn’t ship, doesn’t tune for SOC triage, and doesn’t price.
2. Native automation in Elastic is comparatively recent
Elastic has been building out native Workflows automation, and it’s a welcome direction. It’s also newer ground for the platform than detection and search, where Elastic has years of depth. Response orchestration, including case handling, approval gates, multi-tool remediation, and audit, is a different discipline from finding the attack. It’s the discipline D3 Security has spent more than a decade building.
So here’s the honest gap
After Attack Discovery hands you a clean attack chain, the clock is still running. An analyst has to pivot into identity, endpoint, cloud, and email to confirm scope. Decide on containment. Get sign-off. Then actually run the disable, isolate, block, and revoke across half a dozen consoles. Discovery shortened the first step. The rest is still manual, and the rest is where MTTR lives.
A faster diagnosis doesn’t close the case. The case closes when the response runs, someone accountable approved it, and you can show your work later. That’s the layer this paper is about.
Elastic Data Layer + Morpheus Autonomy Layer
The cleanest way to think about an Elastic-plus-Morpheus SOC is two stacked layers with one handoff. Elastic owns ingestion, search, detection, and discovery. Morpheus owns investigation, decision, approval, and response. The detection that Attack Discovery surfaces becomes the trigger that Morpheus reasons on.
D3 Morpheus: Autonomy & Response Layer
Governed. Explainable. Auditable. Cybersecurity Triage Reasoning Graph (included). Attack Path Discovery cross-stack L2. Approval gate with four autonomy modes on one engine. Response across 800+ self-healing integrations.
Elastic Security: Data & Detection Layer
System of record. Detection engine. Customer-supplied LLM for Attack Discovery. Ingest and search, detections, attack-chain summary, dashboards.
Figure 1. Elastic stays the data and detection layer. Morpheus adds the governed autonomy and response layer above it. The detection triggers the reasoning.
Morpheus doesn’t replace anything in the bottom layer. Your detections, your dashboards, your data stay in Elastic. Morpheus reads the detection, runs its own investigation, and brings the response under the autonomy and approval rules you set.
From Discovery to a Closed, Accountable Case
Governed response is the set of steps between a surfaced attack chain and a closed incident you can defend in an audit. Elastic gets you to the first box. Morpheus runs the rest, and it does it under approval rules you choose. Here’s the full path.
Detection
Elastic Attack Discovery
Investigate
Morpheus APD, cross-stack
Draft Fix
remediation + MITRE map
Approve
autonomy mode gate
Execute
800+ integrations
Audit
one trail per incident
Figure 2. Discovery is the first step. Governed response is the five that follow, all under your control.
The difference that matters is the approval gate sitting in the middle, not bolted on at the end. Morpheus drafts the fix, then waits for the level of human sign-off you’ve configured. Nothing fires that the mode doesn’t permit.
Attack Path Discovery: the investigation Elastic doesn’t run for you
Attack Path Discovery is D3 Morpheus’s read-only L2 investigation engine. It traces every alert across identity, endpoint, cloud, and email, maps the blast radius, aligns findings to MITRE ATT&CK, and drafts the remediation. This is the cross-stack pivoting your analysts do by hand after Attack Discovery hands them the chain. Morpheus does it in under two minutes for up to 95% of alerts, and it does it read-only, so investigation never changes state on its own.
The Cybersecurity Triage Reasoning Graph: included, no BYO-LLM
The reasoning behind that investigation is the Cybersecurity Triage Reasoning Graph, purpose-built SOC reasoning that 60 specialists built over 24 months. It ships with Morpheus. You don’t bring a model, tune it for triage, or pay per token to run it. Contrast that with Attack Discovery, where the model is yours to supply and fund. The graph is the moat, and it’s the reason Morpheus reasons like a SOC analyst out of the box.
One reasoning engine, one audit trail per incident. There is no fleet of agents passing work between themselves. When something goes wrong, there’s a single place to look and a single account to read.
“Isn’t Attack Discovery Plus Workflows Enough?”
It’s the right question to ask, and it deserves a straight answer. Attack Discovery plus native Workflows can take you a real distance: surface the chain, then trigger a workflow off it. For some teams and some alert types, that’s a solid setup, and you should run it where it fits.
The honest limits show up in three places. First, the reasoning still runs on a model you supply and pay for, so investigation depth and token cost track with whatever LLM you wired in. Second, native automation is newer ground for Elastic than detection, so the orchestration, approval-gate, and audit primitives are still maturing. Third, Workflows automate steps you’ve defined; they don’t independently investigate an unfamiliar alert across four domains and reason about it. That investigation is what Attack Path Discovery and the Triage Reasoning Graph do.
Where each layer is strongest
| Capability | Elastic Attack Discovery + Workflows | D3 Morpheus response layer |
|---|---|---|
| Surface attack chain | Yes. Core strength, groups alerts into a readable chain | Consumes the chain as a trigger |
| Reasoning model | Customer-supplied LLM connector; customer owns tuning and token cost (per Elastic docs) | Cybersecurity Triage Reasoning Graph, included; no BYO-LLM |
| Cross-stack L2 investigation | Workflows run predefined steps you author | Attack Path Discovery traces identity, endpoint, cloud, email; maps blast radius; MITRE ATT&CK |
| Autonomy control | Workflow logic; native automation comparatively recent | Four autonomy modes on one engine: Deterministic → AI-Assisted → AI-Led → Autonomous, by configuration |
| Execution breadth | Within Elastic integrations and connected actions | 800+ self-healing integrations; 18-min MTTR on drift vs. 4–6 weeks |
| Audit | Workflow run history | One unified, challengeable audit trail per incident |
This isn’t a knock on Elastic. It’s a division of labor. Elastic is built to find the attack and store the truth of what happened. Morpheus is built to investigate, decide, and respond with a paper trail. Run them together and each does the job it’s best at. The token economics make the split even clearer: when alert volume spikes during an incident, your Attack Discovery inference bill spikes with it, while the included Triage Reasoning Graph carries that same surge without a metered cost. Predictable response cost matters most on your worst day.
Four autonomy modes, same engine, same audit format: Deterministic (SOAR) → AI-Assisted → AI-Led → Autonomous. Start Morpheus in approval-gated mode on day one. Move toward autonomy by configuration as trust builds, with no re-platforming.
Autonomy You Can Actually Defend
Governed autonomy means every action Morpheus takes is bounded by a mode you chose, explainable down to the tool query, and recorded in one trail you can produce on demand. That’s the part that lets a CISO sign off on automation without losing sleep. Agentic on architecture. Autonomous on outcomes. Accountable on every decision.
Governed
Every autonomous action is bounded by your chosen autonomy mode and approval gates. Morpheus can’t exceed the authority you granted it.
Explainable
Every step is a real tool query: timestamped, attributed, and challengeable. No black-box verdicts. You can ask why and get the actual evidence.
Auditable
One unified audit trail per incident. When a regulator, an auditor, or your own board asks, there’s a single record to hand over.
Bounded reasoning
An Agentic Task runs LLM reasoning inside a deterministic playbook: iteration caps, tool-scope limits, output-schema checks. The auditable alternative to a multi-agent mesh.
Why this matters for regulated SOCs
If you operate under disclosure or operational-resilience rules, “the AI did it” is not a defensible answer. Morpheus maps cleanly to the frameworks that govern incident response and AI oversight. The audit trail is built to produce evidence for a human-oversight requirement, not paper over it.
| Framework | What Morpheus supports |
|---|---|
| SEC Item 1.05 | Per-incident audit trail supports material-incident disclosure timelines |
| NYDFS 23 NYCRR 500 | Documented, attributed response actions for financial-services governance |
| DORA / NIS2 | Operational-resilience evidence for EU financial and critical-infrastructure entities |
| EU AI Act Article 14 | Human oversight enforced through autonomy modes and approval gates |
| HIPAA / NERC CIP | Bounded, logged remediation for healthcare and energy environments |
Morpheus runs on Microsoft Azure with data residency in the US, Canada, EU (Ireland), and Japan, with on-prem available. D3 Security is a Microsoft Intelligent Security Association member and is SOC 2 Type II.
Questions for Your Evaluation
Ask any vendor proposing to sit on top of Elastic these questions. The answers separate a real response layer from a workflow wrapper.
- Who supplies and pays for the reasoning model? Is SOC reasoning included, or do I bring an LLM connector and own the tuning and token bill?
- Does it investigate across the full stack on its own? Can it pivot through identity, endpoint, cloud, and email without me scripting each step first?
- Where does human approval sit? Is there an approval gate before action, and can I dial autonomy up or down by configuration, with no re-platforming?
- Is there one audit trail per incident? Can I produce a single, timestamped, attributed record for a regulator or auditor?
- How does it survive integration drift? When a vendor ships a breaking API change, how fast do broken response actions self-heal?
- Does it keep Elastic intact? Do my detections, dashboards, and data stay in Elastic as the system of record?
Next Steps
Book a 30-minute demo on real alerts
Live on your alert types, no slides. See Attack Path Discovery investigate a chain Elastic surfaced. d3security.com/demo
Run Morpheus alongside your Elastic deployment
Start in approval-gated mode. Keep Elastic as your data and detection layer. Measure MTTR before and after on your own queue.
Review the Elastic integration and autonomy modes
See d3security.com/integrations/elastic and /morpheus/autonomy-modes.
D3 Security: Company Summary
D3 Security builds D3 Morpheus, the autonomous SOC platform that triages, investigates, and responds to alerts with a full audit trail behind every decision. Morpheus is trusted in demanding environments including PwC, Scotiabank, S&P Global, Cummins, the London Stock Exchange, and the U.S. Department of Defense. The promise is simple: noise down, security up. Learn more at https://d3security.com.