We’re delighted to introduce some sought-after enhancements this month to the Smart SOAR platform. We’ve refined our reporting dashboard, upgraded the widget query builder, and enhanced the Incident Workspace. Additionally, the Monitor Module and Playbook Task Details have been adjusted to cater to your preferences. Read on for a summary of enhancements, improvements, integrations, and new utility commands.
Reporting Dashboard Enhancements
Reporting Dashboards and Widgets: Enhanced Permission Controls

The permission controls have been enhanced for both widgets and dashboards, offering more precise access control. You now have two main ways to configure permissions:
- By Site: Assign permissions based on specific sites. Choose whether each site has viewer or editor permissions. Dive deeper by setting additional permissions by group and role within each site.
- By User: Allocate permissions directly at the user level. Specify whether an individual user has viewer or editor access.
New Private Mode
We’ve also introduced a Private Mode feature. When activated, only the original creator of a dashboard or widget will have the rights to view and edit it.
Widget Query Builder: Time-Based Filtering by Most Recent Hours

We’ve updated the widget query builder to include a new time filter feature. You can now focus your queries on data from a minimum time frame of just 1 hour, up to a maximum of 999 hours, for customized, high-precision insights.
Incident Workspace Enhancements
Investigation Tab: Fully Editable Sections

All sections within the Investigation Tab can be directly edited from the user interface, including both HTML and JSON content. All edits are logged by the command center for auditing and traceability.
Overview Tab: Customizable Layouts by Incident Type
The Overview Tab now allows for greater customization across different incident types. You can rearrange or toggle most sections—excluding Key Fields—to fit your needs. For example, you can configure one layout for brute-force incidents and another for malware incidents. To modify these settings, go to Configuration > Incident Form Editor and select the incident type you wish to customize.

Monitor Module Update

In this update, we’re introducing a change to the Monitor module’s naming convention. When MITRE tactics are enabled within the module, it will now be displayed as MITRE ATT&CK Monitor. Additionally, users who have roles designated with “Client” access permissions for the Managed Security Service Provider (MSSP) portal will now have the capability to view the Monitor module.
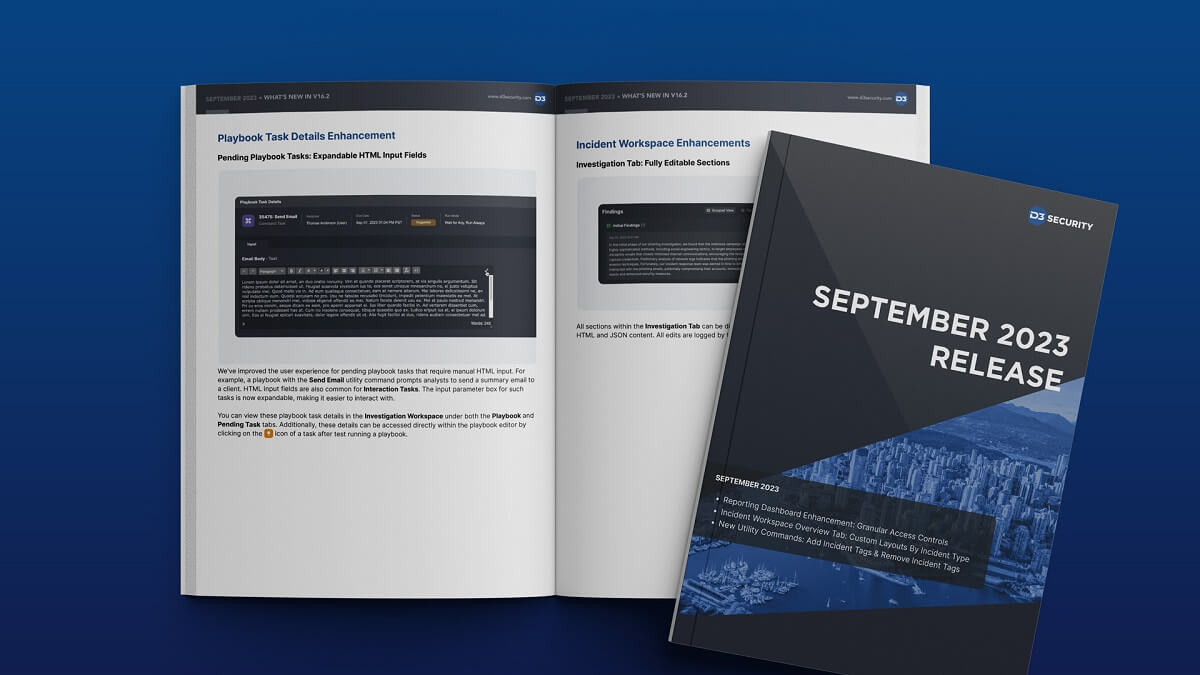
Playbook Task Details Enhancement
Pending Playbook Tasks: Expandable HTML Input Fields

We’ve improved the user experience for pending playbook tasks that require manual HTML input. For example, a playbook with the Send Email utility command prompts analysts to send a summary email to a client. HTML input fields are also common for Interaction Tasks. The input parameter box for such tasks is now expandable, making it easier to interact with.
You can view these playbook task details in the Investigation Workspace under both the Playbook and Pending Task tabs. Additionally, these details can be accessed directly within the playbook editor by clicking on the icon of a task after test running a playbook.
Application Settings Enhancement
New Web Config Key: HideEventNodesOnLinkAnalysis

We’ve added a new web config key within the application settings to help you declutter your Link Analysis view in the Incident Workspace. With this new option, you can now choose to hide event nodes.
Utility Commands

The following utility commands have been added to this release of D3 SOAR.
| Commands | Functionality |
| Add Incident Tags | Adds or overwrites incident tags of the specified incident. |
| Remove Incident Tags | Removes incident tags from the specified incident. |
| Get PDF File Content | Extracts all text and hyperlinked URLs from PDF files attached as Playbook Files, Artifact Files, or Incident Attachment Files. |